Graph Explorer
The graph explorer is an interactive visualization of your spec graph — available in your browser, as a standalone CLI command, or inside VS Code. It renders documents as nodes in a force-directed layout, grouped into clusters by prefix, with edges showing Implements, DependsOn, and References relationships.
Quick Start
Section titled “Quick Start”Run the explorer from any project with a supersigil.toml:
supersigil exploreThis generates a self-contained HTML file and opens it in your default browser. The visualization uses the same D3.js module that powers the hosted explorer on this docs site.
To save the HTML to a file instead of opening it:
supersigil explore --output graph.htmlIn Your Editor
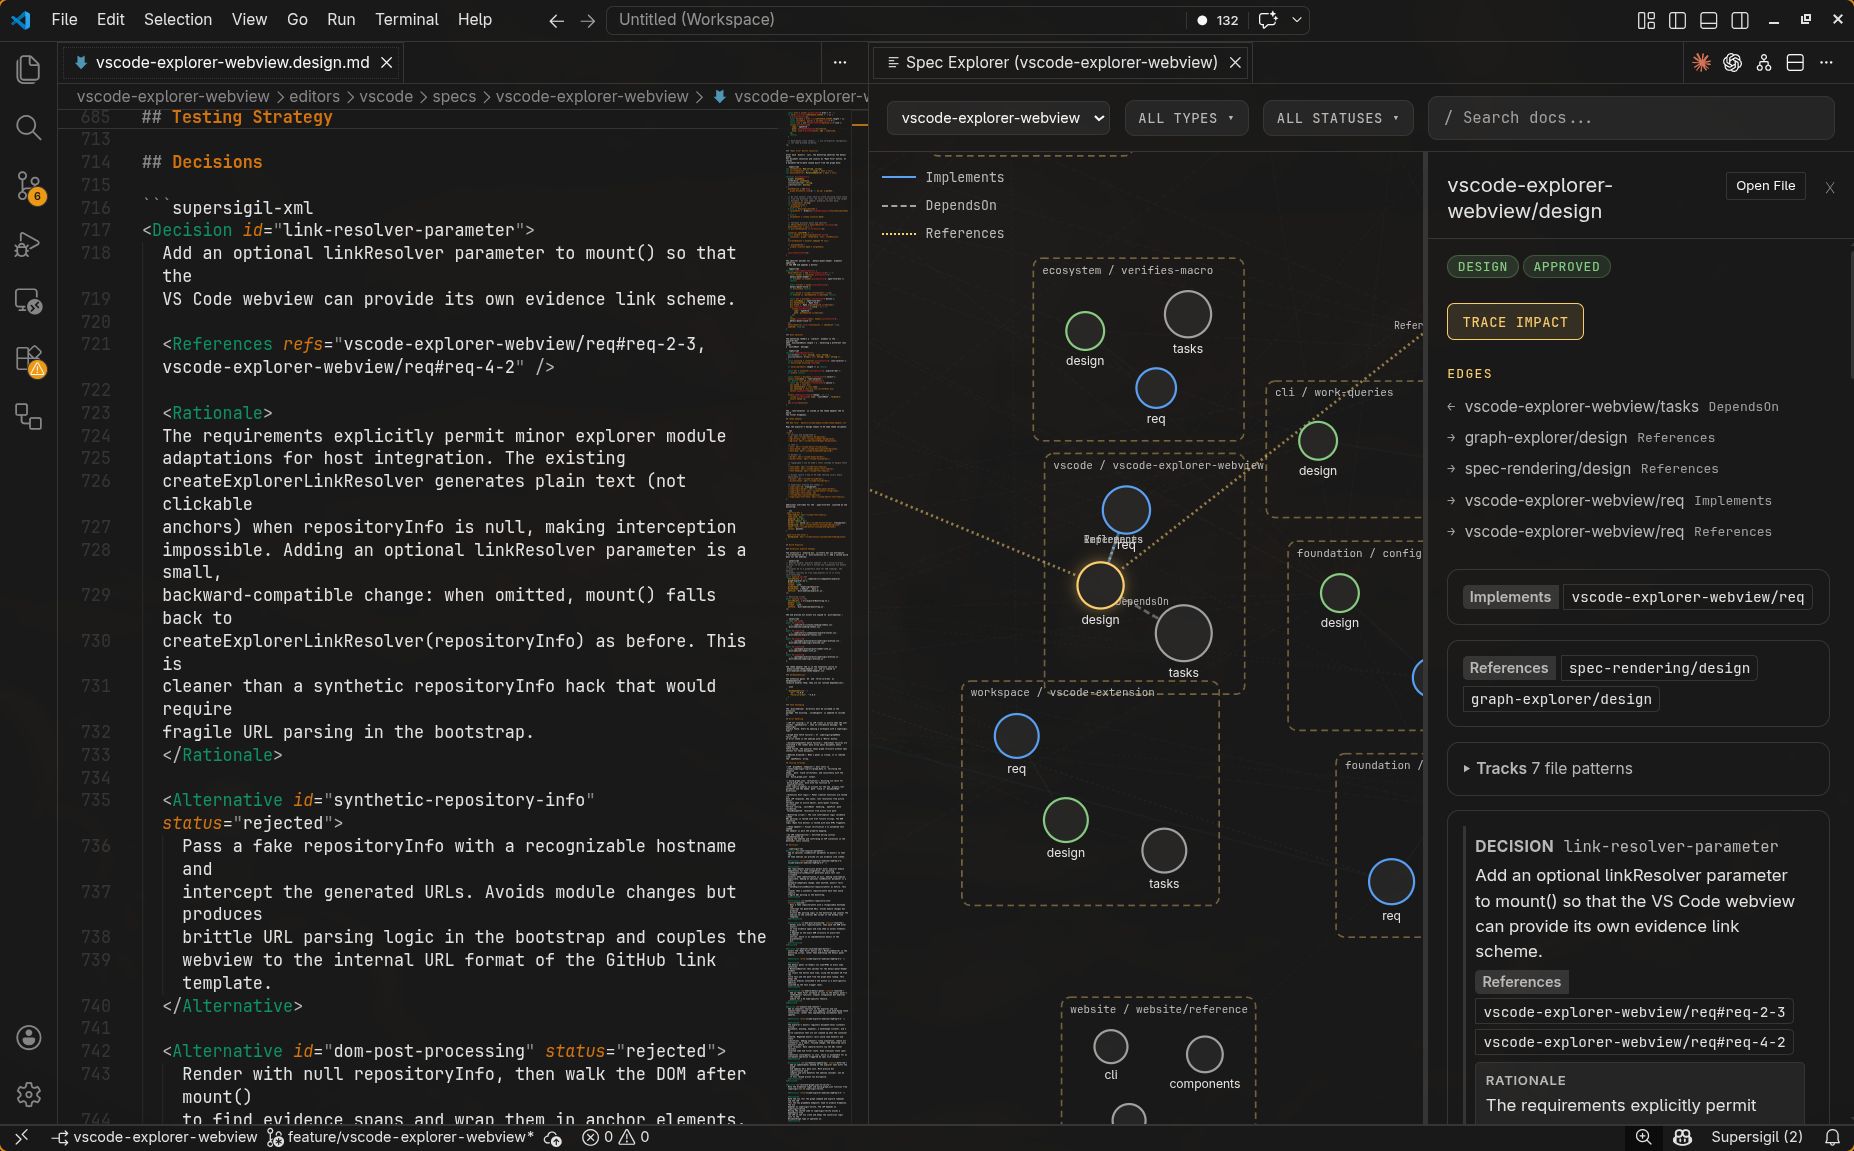
Section titled “In Your Editor”The same graph explorer runs inside VS Code as a webview panel. Click the graph icon (⬡) in the editor title bar to open it.
- Context-aware — the graph opens scoped to the workspace root of your active file, with that file’s spec node auto-focused.
- Navigate to source — click “Open File” in the detail panel to jump to the spec’s Markdown source. Evidence links open test files at the exact line.
- Live updates — the graph refreshes automatically when specs change. Your selection and filters are preserved across updates.
- Multiple panels — open as many graph panels as you want, each scoped to a different workspace root. In multi-root workspaces, a root selector dropdown lets you switch roots within a panel.
- Supersigil Specifications tree — the Explorer sidebar includes a “Supersigil Specifications” section listing all spec documents grouped by feature area. Hover over a document to see an inline button that opens it in the graph explorer.
The in-editor graph uses the same D3.js visualization, the same detail panel with rendered spec content, and the same filtering and search as the standalone CLI output and the hosted explorer.
What You See
Section titled “What You See”The explorer shows your spec graph with:
- Document nodes — circles colored by type: teal for requirements, green for design, gold for ADR, gray for other types. Node size scales with component count.
- Cluster borders — dashed rectangles grouping documents that share an ID prefix (e.g.,
parser/parser.reqandparser/parser.designcluster underparser). - Edges — lines between documents labeled with the relationship kind (Implements, DependsOn, References).
Interactions
Section titled “Interactions”Navigate
Section titled “Navigate”- Pan: drag the background
- Zoom: scroll wheel
- Drag nodes: reposition individual nodes (the simulation reheats to settle)
Inspect
Section titled “Inspect”- Click a node to open the detail sidebar showing document type, status, edges (incoming and outgoing), and components
- Double-click a node to drill into its internal components — Criteria, Tasks, Decisions with their Rationale and Alternatives appear as child nodes inside the cluster
Filter
Section titled “Filter”The top bar provides type toggle chips and a status dropdown. Click a type chip to show only documents of that type. Filtered-out nodes fade to near-invisible but remain in place, preserving spatial context.
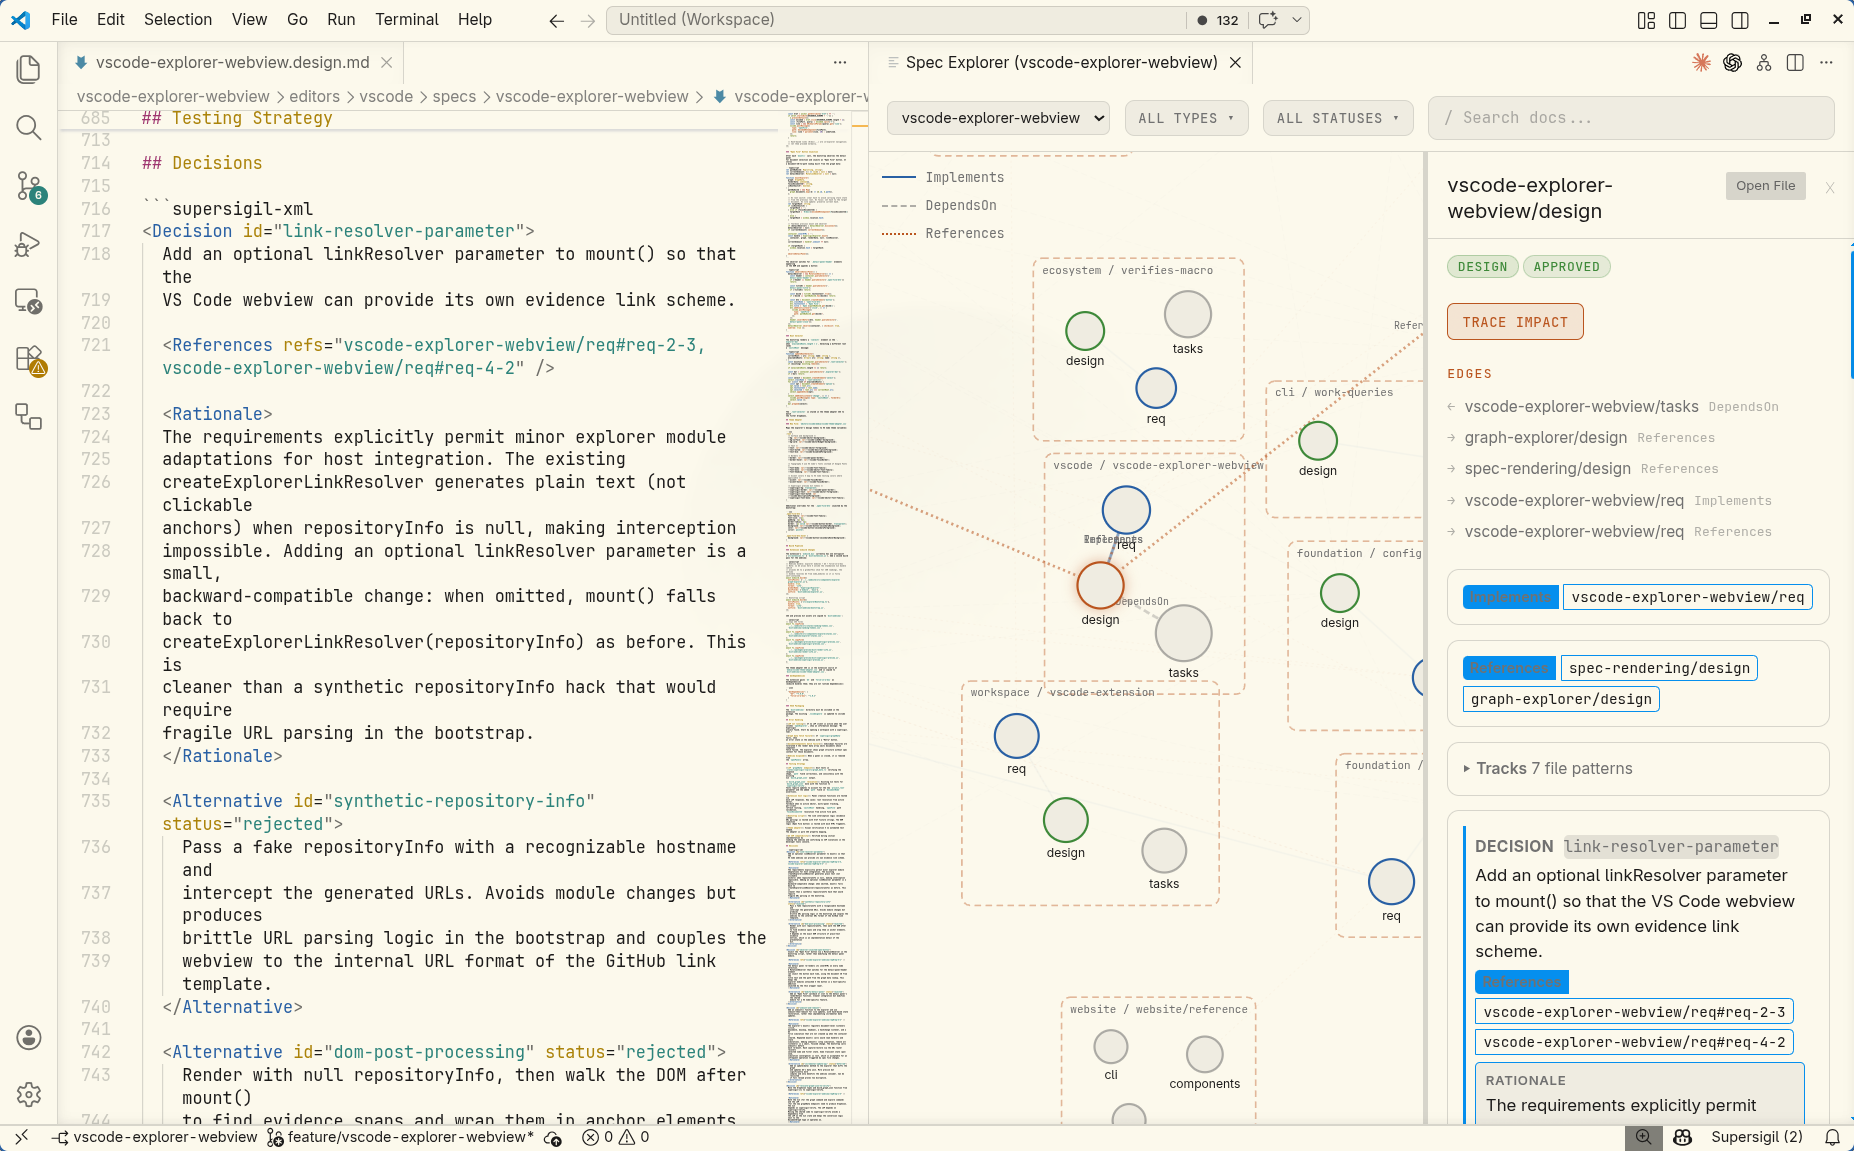
Trace Impact
Section titled “Trace Impact”With a node selected, click Trace impact in the detail sidebar to highlight everything downstream — all documents that transitively depend on or implement the selected document. The traced subgraph renders at full opacity with gold edges; everything else dims. Click the background to clear the trace.
Search
Section titled “Search”Type in the search box (or press /) to fuzzy-match on document ID and title. Selecting a result zooms to the node and opens its detail panel.
Share Views
Section titled “Share Views”The URL hash updates as you interact, encoding node selection, active trace, and filter state. Copy the URL to share a specific view with teammates.
Hash patterns:
#/doc/{id}— select a document#/doc/{id}/trace— select and trace#/filter/type:{types};status:{status}— filter state
Evidence Source Links
Section titled “Evidence Source Links”When a document has verification evidence (from #[verifies] annotations or <VerifiedBy> declarations), the detail sidebar shows evidence source locations. If repository information is available, these locations are clickable links to the source file in your Git hosting provider.
Repository info is resolved automatically from Cargo.toml’s repository field for Rust projects. For other setups, or to override the inferred value, add [documentation.repository] to your config:
[documentation.repository]provider = "github"repo = "myorg/myproject"GitHub, GitLab, Bitbucket, and Gitea are supported. See the configuration reference for all options.
When no repository info is configured or inferred, evidence locations display as plain text without links.
Docs Site Integration
Section titled “Docs Site Integration”The explorer is also available as a page on the docs site at /explore/. The hosted version uses the same visualization module and
design system as the standalone CLI output.
JSON Graph Format
Section titled “JSON Graph Format”The explorer consumes the JSON output of supersigil graph --format json. The format includes:
documents— array of document objects withid,doc_type,status,title, andcomponentsedges— array of{ from, to, kind }objects representing document-level relationships
This format is also useful for building custom tooling on top of the spec graph.